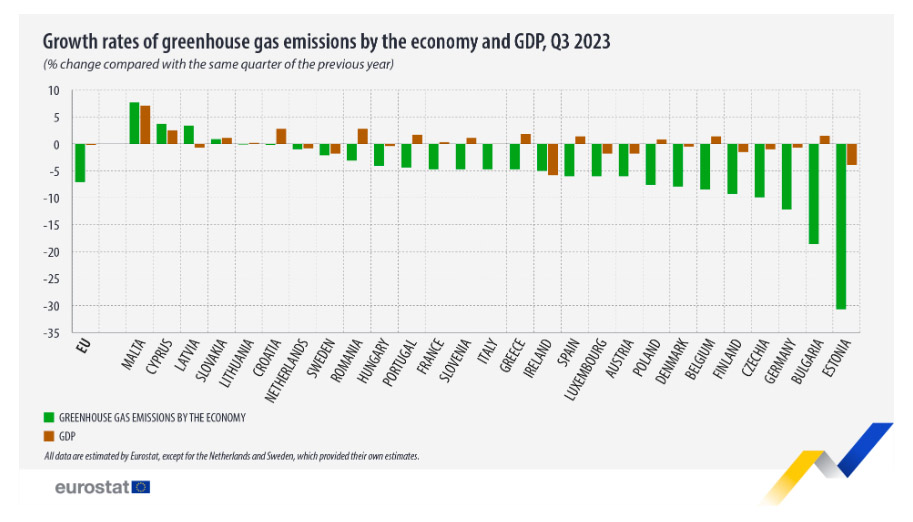
In the third quarter of 2023, EU economy greenhouse gas emissions are estimated at 787 million tonnes of CO2-equivalents (CO2-eq), a -7.1% decrease compared with the same quarter of 2022 (847 million tonnes of CO2-eq). The EU’s gross domestic product (GDP) remained stable, registering just a small variation (-0.2% in the third quarter of 2023, compared with the same quarter of 2022).
This information comes from data on quarterly estimates for greenhouse gas emissions by economic activity published by Eurostat. Quarterly estimates of greenhouse gas emissions complement quarterly socio-economic data, such as GDP or employment.

During this period, greenhouse gas emissions are estimated to have decreased in 23 EU countries, when compared with the third quarter of 2022, with the exception of Malta (+7.7%), Cyprus (+3.7%), Latvia (+3.4%) and Slovakia (0.9%). The largest reductions in greenhouse gases are estimated for Estonia (-30.7%), Bulgaria (-18.6%) and Germany (-12.2%).
Out of the 23 EU members that are estimated to have decreased their emissions, 11 also recorded a decline in their GDP (Ireland, Estonia, Austria, Luxembourg, Sweden, Finland, Czechia, Netherlands, Germany, Denmark, Hungary). Italy maintained its GDP at the same level as in the third quarter of 2022 while decreasing its GHG emissions. The other 11 EU countries (Romania, Croatia, Greece, Portugal, Bulgaria, Belgium, Spain, Slovenia, Poland, France, Lithuania) are estimated to have managed to decrease emissions while growing their GDP.
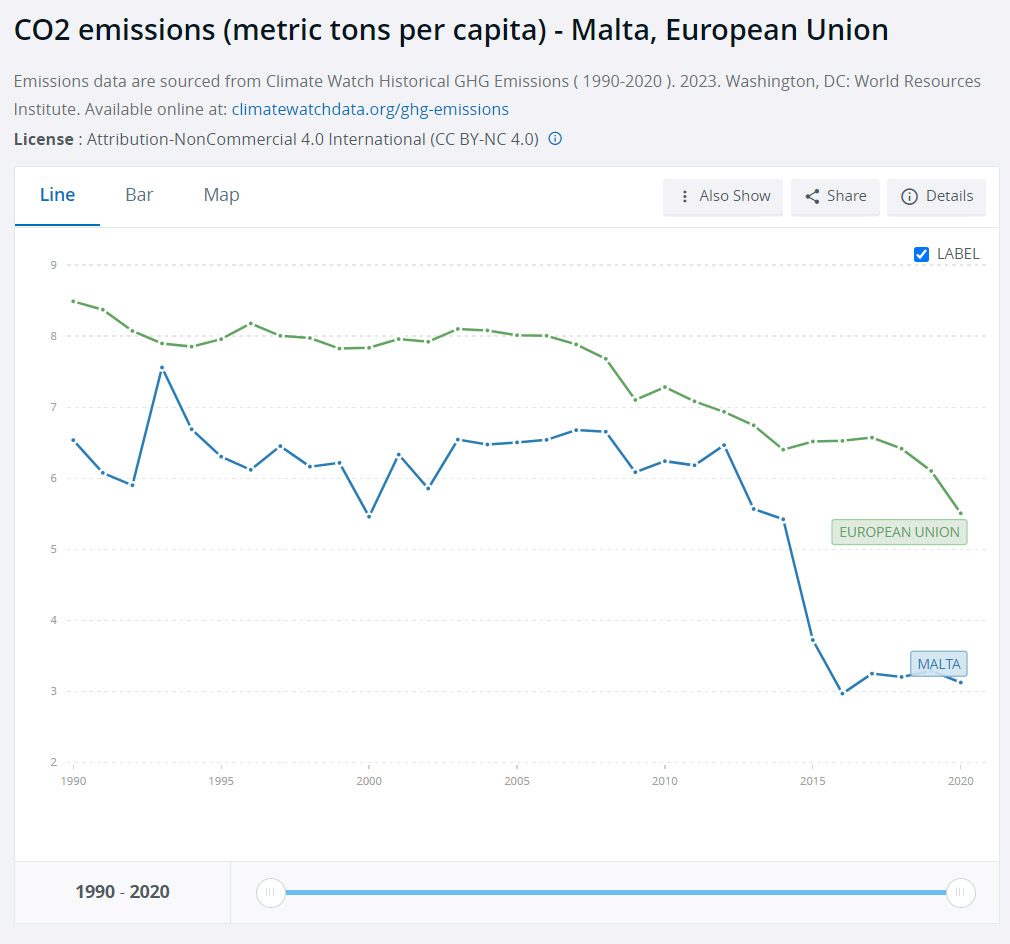
Meanwhile, according to data from the World Bank, Malta and Sweden register the EU’s lowest rate of emissions per capita. The average for 2020 based on 43 countries was 5.33 metric tons. The highest value was in Luxembourg: 12.46 metric tons and the lowest value was in Albania: 1.54 metric tons. For the period 1990 to 2020, the average value for Malta was 5.7 metric tons with a minimum of 2.97 metric tons in 2016 and a maximum of 7.56 metric tons in 1993. The latest value from 2020 is 3.13 metric tons. For comparison, the world average in 2020 based on 185 countries is 3.84 metric tons.

Sources:
https://ec.europa.eu/eurostat/web/products-eurostat-news/w/ddn-20240214-1
https://data.worldbank.org/indicator/EN.ATM.CO2E.PC?end=2020&locations=MT-EU&start=1990&view=chart
https://www.theglobaleconomy.com/Malta/Carbon_dioxide_emissions_per_capita/